Good day Hiveians!
Join me in analyzing the crypto markets!
What a Ride!
... but I can't say that I am surprised 😁
As of this writing Hive topped out at around 97 cents which was a 80%+ rise from yesterday.
Just 4 days ago I wrote a post about Hive "Breaking Out Big" in which I argued that it is currently quite likely for Hive to reach 70-80 cents in the next pump. This is the third time in a month that we have correctly anticipated a pump for Hive on my blog here!
See the other successful predictions here.
I don't know if I just got lucky, but so far we are exactly on the path laid out in my previous posts. In fact it all goes back to the idea I had in June in the midst of the big crashes that the bear market might have already pretty much ended. Sure, it might be unlikely that we just get a rally straight off of the lows (BTC at 17k), but I doubted that prices would just continued to fall. So far it seems that this is holding true.
But we have to know that when we are looking at Coins/Tokens that they all have their own patterns and shapes in which they are moving. While they are all still dependent on Bitcoin at large, they can move on its own as well. Hive is a great example, as we always get these extreme rallies in a red market. Hive never rallies when Bitcoin explodes upward because all the liquidity is going into Bitcoin - altcoins therefore tank.
TA for Hive
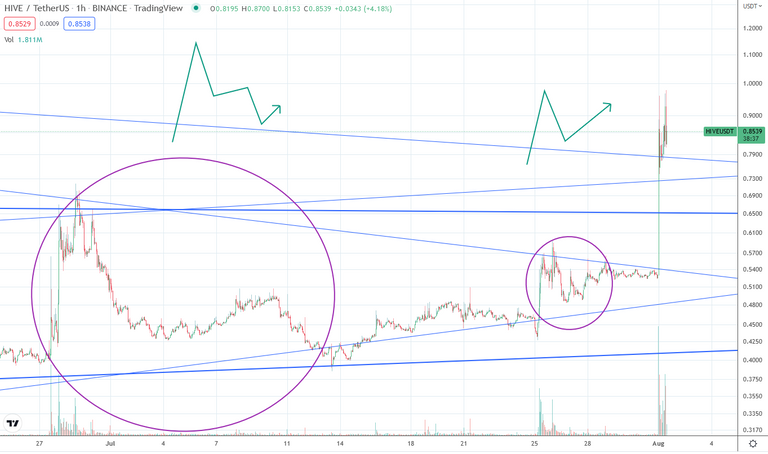
First let's look at the 4h chart. We see all of the 3 pumps over the last month. One of the important things to understand when trying to predict a trend is to know the fractal for the coin/token you are analyzing. For Hive it is drawn in the top left corner (in green). We see this pattern repeated (in a modified shape!) literally for all of the 2 years Hive has been trading on all scales. On the right you see the 2nd pump which looks quite a bit different. It is lacking the long corrective part with its up and final down movement. This made me suspicious. If you look at past movements like this, it was an indicator for a higher move upwards. In other words, this fractal was not "behaving" like it was supposed to. When this happens strong market movements (to either side) tend to occur.
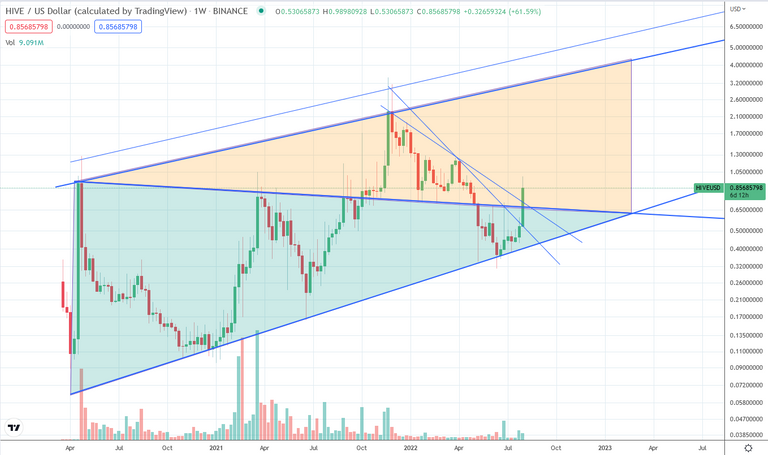
And indeed, we got the massive breakout to almost $1. But I gave another argument in this post for why I thought a breakout to the top was more likely. For other reasons we have to look at the scale. The bigger the scale we are looking at the more long term our outlook becomes. I made this chart last time which correctly predicted current price movements.
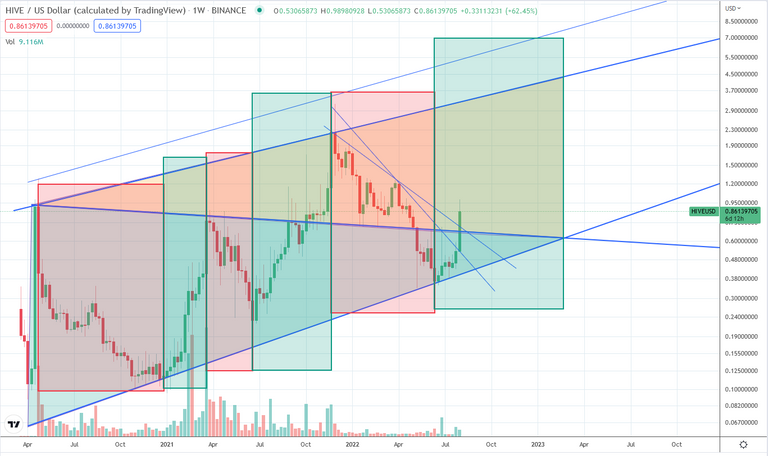
The main hint for this came from the bigger picture. I'll provide it here again:
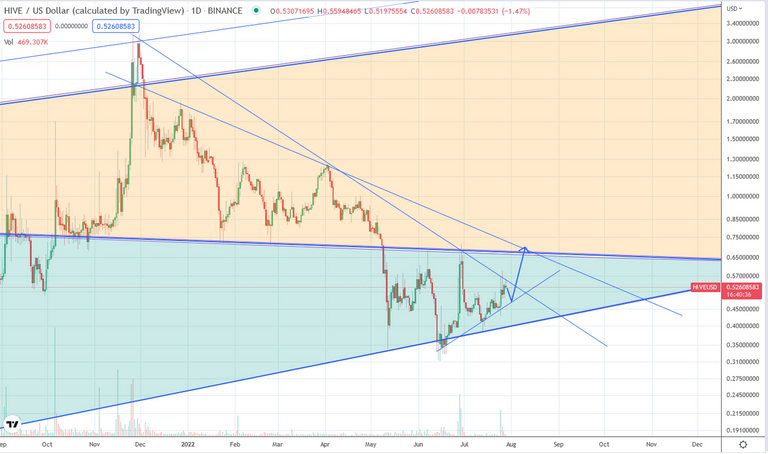
Here we can see Hive moving in an ascending converging channel that is separated by a horizontal divide. Hive had bounced off of the support at about 30 cents and is now moving towards the upper edge of this channel. The horizontal divide will play a role in the short term (and perhaps the long term). It is very(!) likely that Hive will head back to the trend lines from which it broke out over the next couple of weeks which now also includes this divide. It could look something like this:
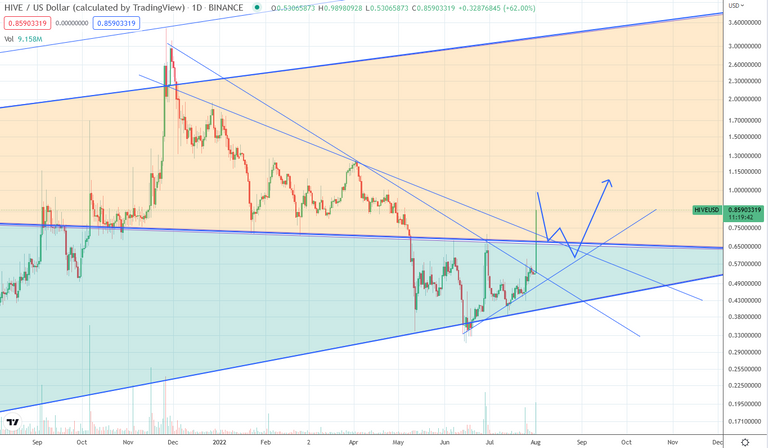
In other words, a retracement back to about 55-60 cents is quite likely. But the important thing is that price would then have the support from the former resistances (espeically the horizontal divide).
Long term I think Hive is heading back to $5-$8 range over the next half a year or so. Although it might not be a straight line up as I still think the bear market for the entire crypto market is not over yet and could last until about fall/winter of 2022.
As a general reminder: Please keep in mind that none of this is official investment advice! Crypto trading entails a great deal of risk; never spend money that you can't afford to lose!


Check out the Love The Clouds Community if you share the love for clouds!
</center